Dataset: Model results containing monthly Lagrangian transition probability distributions in the S. California Bight from 1996-2007
Principal Investigator: David Siegel (University of California-Santa Barbara)
Co-Principal Investigator: Rachel D. Simons (University of California-Santa Barbara)
BCO-DMO Data Manager: Danie Kinkade (Woods Hole Oceanographic Institution)
Project: Quantifying the importance of biological factors in the estimation of larval connectivity and population dynamics in the coastal ocean (larval connectivity)
Model output and related files (described below) are available from the project website.
Monthly_Cij_Files_1996_2007.zip- Zip file containing monthly Lagrangian transition probability distributions from 1996 to 2007 from and to the 135 sites in the Southern California Bight. Results are provided as three-dimensional matrices (source_index, destination_index, advection_time) in Matlab .mat format.
Additional/Supplemental files:
ConnectivityMatrixManipulationExample.m– Matlab .m script file that calculates mean connectivity matrices for given advection time and estimates mean and minimum oceanographic times and from the monthly Particle Distribution Function (PDF) matrices. Will run on the unzipped monthly Cij folders with this program in the same directory.
plot_connect_funky.m- Matlab .m function that plots connectivity matrices with site locations.
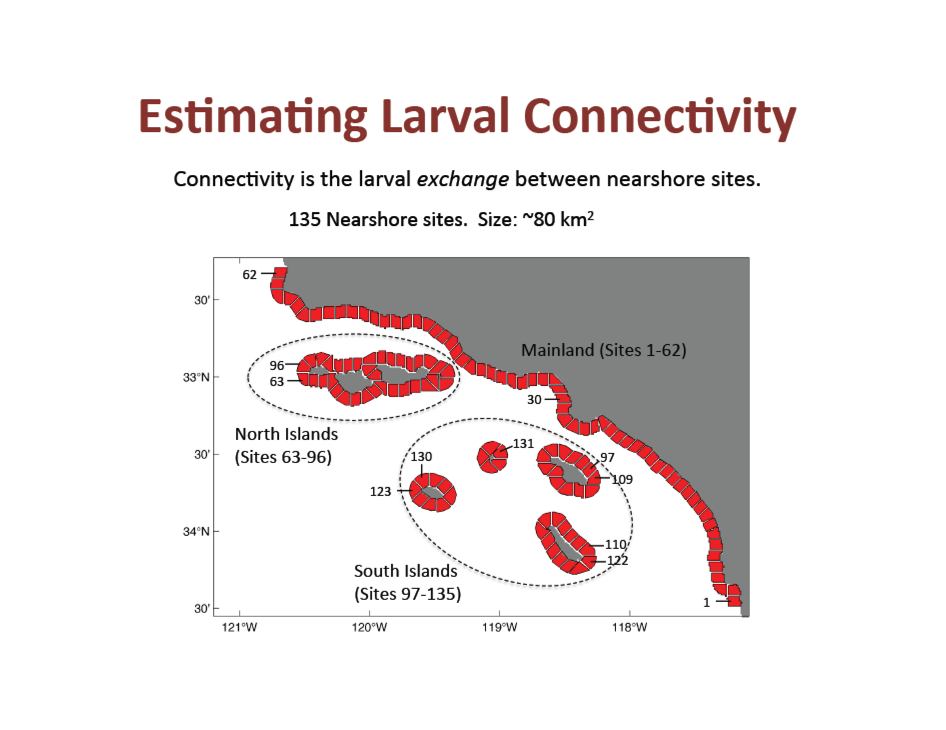
site_centers.mat- Matlab .mat file of the latitude and longitude for the center for each of the 135 sites.
SBC_sites_map.pdf– graphical representation of the 135 sites around the Southern California Bight (also below).

Related Datasets
No Related DatasetsRelated Publications
No Related PublicationsSiegel, D., Simons, R. D. (2016) Model results containing monthly Lagrangian transition probability distributions in the S. California Bight from 1996-2007. Biological and Chemical Oceanography Data Management Office (BCO-DMO). (Version 2016-05-09) Version Date 2016-05-02 [if applicable, indicate subset used]. http://lod.bco-dmo.org/id/dataset/644970 [access date]
Terms of Use
This dataset is licensed under Creative Commons Attribution 4.0.
If you wish to use this dataset, it is highly recommended that you contact the original principal investigators (PI). Should the relevant PI be unavailable, please contact BCO-DMO (info@bco-dmo.org) for additional guidance. For general guidance please see the BCO-DMO Terms of Use document.
